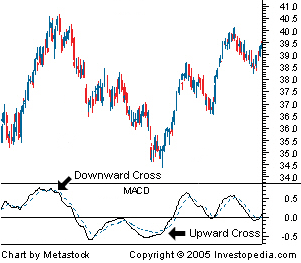
It is a trend following momentum indicator showing the relationship between 2 moving averages.
The MACD is calculated by:
- subtracting the 26-day exponential moving average (EMA) from the 12-day EMA.
- A 9-day EMA of the MACD is plotted on top of this.
- It is used as a signal line to indicate when to buy and sell.

Interpretation
Crossovers
When the MACD falls below the signal line, it is a “bearish” signal which indicates that it may be time to sell.
Conversely, when it rises above the signal line, it may indicate an upward momentum.
Divergence
When the price diverges from the MACD, it means the end of the current trend.
A Dramatic Rise
When the shorter term (9 day EMA) pulls away from the longer term (26 day EMA) it means that the stock is overbought and will soon return to normal levels.
Other
When the line moves above or below the zero line, this is a signal the position of the short term average relative to the long term average.
When it is above zero, the short term average is above the long term average. This indicates upward momentum. When it is below zero, it indicates downward momentum.